Financial planning tools often fail because they demand too much effort before delivering value. Users arrive with strong intent but very little patience. This case study explores how a redesigned EPF Calculator transformed from a friction-heavy utility into an engaging financial planning experience through behavioral UX design, backend abstraction, and interactive visualization.
Project Overview
The original provident fund calculator was mathematically accurate but behaviorally inefficient. The interface exposed backend financial structures directly to users, forcing them to understand payroll terminology, contribution rules, and regulatory assumptions before receiving any useful output.
Most users did not arrive with this information readily available. Instead of helping users estimate their future savings quickly, the tool created friction at nearly every step of the interaction process.
The redesign initiative focused on simplifying the entry experience without compromising the integrity of the calculations. The objective was not to reduce financial accuracy but to improve how complexity was translated for users.
The Original Problem
The calculator suffered from a common enterprise UX issue: the user interface reflected the structure of the database rather than the mental model of the user.
To generate a projection, users were asked to manually enter:
- Basic Salary
- Dearness Allowance (DA)
- Contribution percentages
- EPF interest rates
- Expected salary growth
- Retirement assumptions
While these inputs were technically necessary, most salaried employees did not know the exact values offhand. Users typically remembered their take-home salary or annual CTC rather than payroll breakdown structures.
This forced many users to pause the experience to search for salary slips, calculate percentages manually, or guess values entirely.
Key Friction Points Identified
Cognitive Friction
Users were expected to understand financial and payroll terminology before interacting with the calculator. This significantly increased the mental effort required to begin.
Research Burden
The tool required users to know changing regulatory values such as current EPF interest rates and salary growth assumptions. Instead of reducing uncertainty, the interface transferred complexity directly to the user.
Form Fatigue
The interface relied heavily on stacked input fields and static forms. Visually, the experience resembled administrative paperwork rather than financial planning.
Product Goals
The redesign strategy focused on four major objectives:
- Reduce the effort required to start calculations
- Increase interaction depth and engagement
- Encourage users to explore multiple scenarios
- Make compound growth visually understandable
The team approached the problem through behavioral UX principles rather than visual redesign alone.
Phase 1: Smart Defaults and Backend Abstraction
The first redesign intervention focused on removing unnecessary decision-making from the initial interaction flow.
Instead of forcing users to enter detailed payroll structures, the calculator requested only a single familiar input: gross monthly salary.
The system then handled the remaining complexity internally using backend rules and default assumptions.
User Inputs Gross Salary
↓
System Estimates Basic Pay Range
↓
Contribution Ratios Applied Automatically
↓
Current EPF Rates Pulled Dynamically
↓
Instant Projection Generated
The redesigned logic automatically:
- Estimated Basic Pay as 40% to 50% of gross salary
- Fetched current statutory EPF interest rates dynamically
- Applied standard contribution assumptions
- Pre-filled salary growth projections
This allowed users to receive immediate results without needing detailed financial knowledge.
Advanced settings remained available for experienced users who wanted granular control over calculations.
Phase 2: Replacing Text Inputs with Interactive Sliders
The second redesign focused on improving interaction mechanics.
Traditional text fields introduced physical and psychological friction. Typing values repeatedly made the process feel like administrative work.
To reduce this friction, the interface replaced key numerical inputs with interactive sliders for:
- Salary growth
- Retirement age
- Contribution values
- Expected returns
As users adjusted sliders, calculations updated instantly in real time.
This transformed the calculator from a static utility into an exploratory simulation tool. Users began experimenting with different financial futures rather than completing a single calculation and leaving.
Phase 3: Visualizing Compound Growth
One of the biggest behavioral challenges in financial planning is helping users understand exponential growth.
Most people mentally calculate savings linearly and fail to appreciate the long-term effect of compounding.
The redesign addressed this using interactive visual analytics.
A dynamic donut chart separated:
- User contributions
- Employer contributions
- Interest earned through compounding
This visual separation made long-term wealth accumulation immediately understandable.
Users could clearly see how interest growth eventually exceeded their direct contributions, creating a stronger emotional connection with retirement planning.
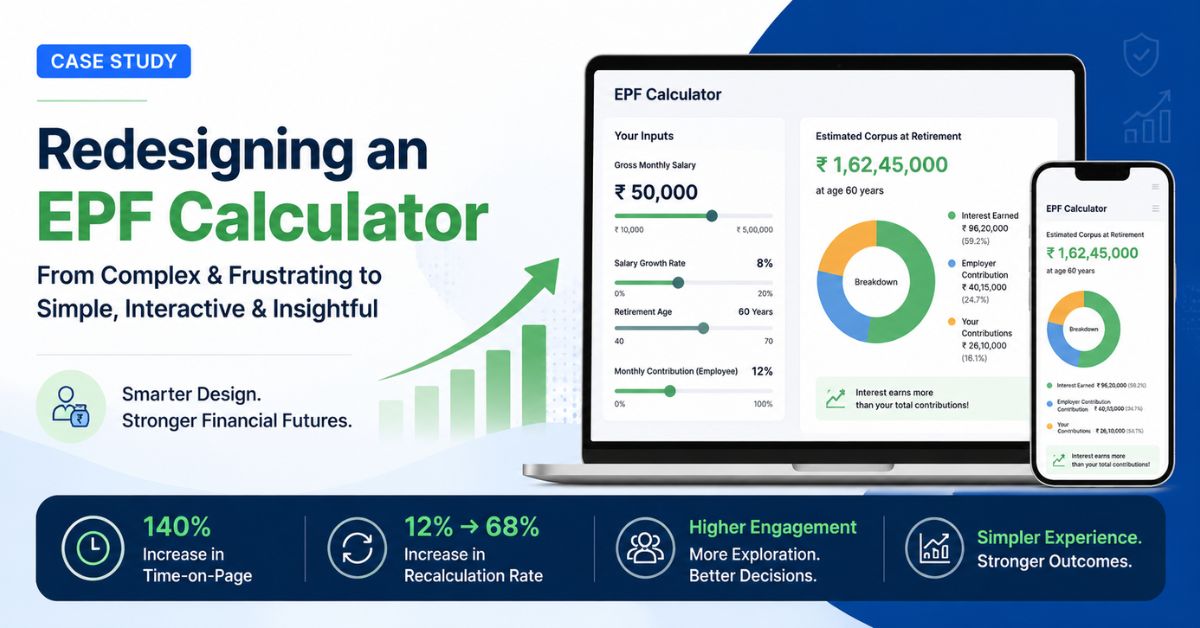
Performance Outcomes
140% Increase in Time-on-Page
The increase in session duration reflected deeper engagement rather than confusion. Users actively explored different scenarios instead of abandoning the experience after a single calculation.
Recalculation Rate Increased from 12% to 68%
The redesigned interface significantly reduced cognitive load and encouraged experimentation.
Users frequently adjusted:
- salary growth assumptions,
- retirement timelines,
- monthly contributions,
- and projected outcomes.
The tool evolved from a one-time utility into an interactive financial planning environment.
Improved User Confidence
User feedback indicated that the experience felt:
- less intimidating,
- easier to understand,
- and more trustworthy.
The calculator no longer resembled a compliance form. It behaved like a modern decision-support tool.
Key UX Principles Behind the Success
Reduce the Cost of Starting
Users are far more willing to refine information after receiving an initial result. The redesign minimized the effort required to begin.
Hide Complexity Without Removing Capability
Advanced functionality remained available without overwhelming casual users during the first interaction.
Reward Interaction Immediately
Real-time feedback transformed the interface into a responsive exploratory environment.
Use Visualization to Improve Financial Understanding
Visual separation of contributions and compound interest helped users intuitively understand long-term growth.
Business Impact
Beyond engagement metrics, the redesign strengthened the overall value of the platform.
The improved experience contributed to:
- higher user retention,
- longer session durations,
- increased repeat usage,
- stronger user trust,
- and greater interaction with related financial tools.
The calculator evolved from a passive utility into a strategic engagement asset within the broader Financial Calculator ecosystem.
Final Takeaway
The mathematical logic behind the provident fund calculator never changed. The success came from redesigning how complexity was presented to users.
By abstracting backend calculations, reducing cognitive friction, and delivering immediate visual feedback, the product transformed a traditionally bureaucratic experience into an engaging financial planning journey.
This case study demonstrates that simplicity in digital products is not the absence of complexity. It is the careful management of complexity behind the interface.