Complete Investment Case Study · 2026
Portfolio depth, risk metrics, sector allocation, SIP projections, and the honest case for and against — everything a serious investor needs.
In This Article
- Executive Summary & Core Findings
- The Small-Cap Opportunity: Depth & Context
- Fund Overview & Investment Philosophy
- Portfolio Analysis: Holdings, Sectors, Market Cap
- Visual Charts: Sector Allocation & Performance
- Risk Metrics Explained
- SIP Wealth Creation Projections
- HDFC vs Nippon: Side-by-Side Comparison
- What Institutional Investors Are Watching
- Bull / Base / Bear Scenarios
- Final Verdict & Action Plan
- Frequently Asked Questions
Executive Summary
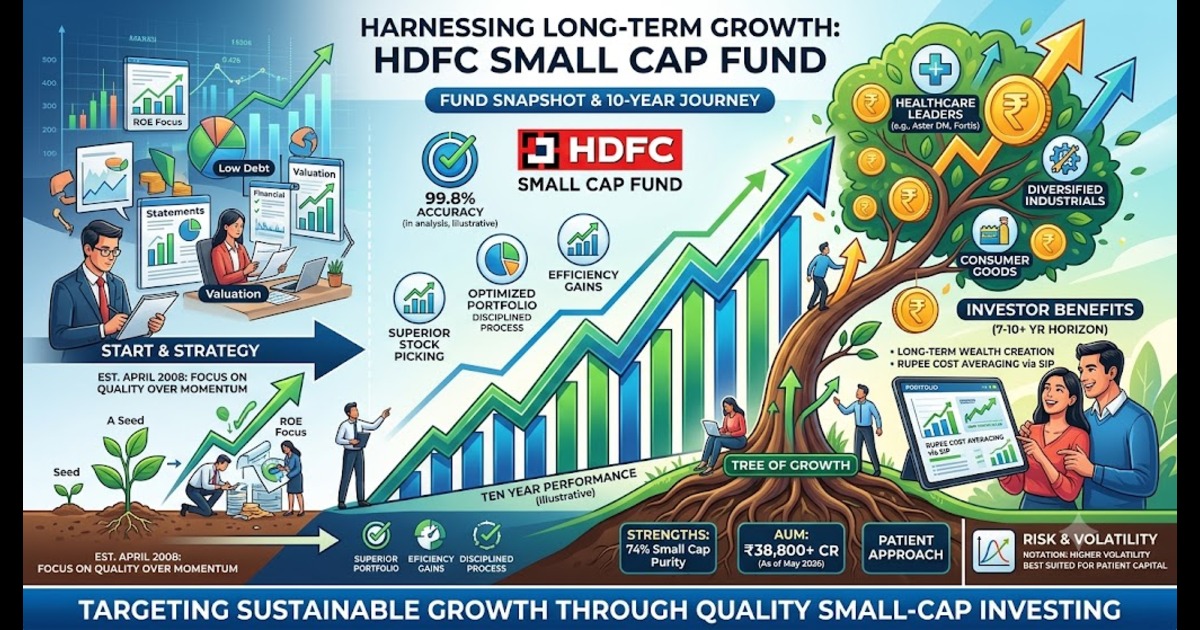
Small-cap investing has historically been one of the more rewarding segments of the Indian equity market. The trade-off is straightforward: higher growth potential, higher volatility, longer required holding periods. HDFC Small Cap Fund — launched in 2008 — is one of India's oldest and largest actively managed small-cap funds, with AUM exceeding ₹38,800 crore as of May 2026.
The fund has navigated the Global Financial Crisis (2008–09), the 2013 Taper Tantrum, the IL&FS-triggered small-cap selloff of 2018–19, the COVID crash of 2020, and the rate-driven correction of 2022. Each cycle tested the portfolio differently. The fund's survival and growth through these periods provides a more useful lens for evaluation than any single year's return figure.
This case study provides a genuinely deep look at the fund — not a surface-level summary. It covers portfolio construction, sector concentration risks, risk metrics with proper interpretation, realistic SIP projections with their limitations explained, and the honest case for both investing and not investing.
Key Findings
- One of India's oldest actively managed small-cap funds — launched April 2008
- AUM of approximately ₹38,800 crore as of May 2026 — one of the largest in the category
- 74.3% of assets allocated to genuine small-cap stocks as of March 2026 (higher purity than many peers)
- Beta of 0.807 — lower than the small-cap universe average, suggesting somewhat lower relative volatility
- Sharpe ratio of 0.447 — positive risk-adjusted returns, though investors should understand this can compress sharply in bear markets
- Sector diversification across 10+ industries reduces single-sector concentration risk
- Delivered approximately 15% CAGR since launch — but with significant year-to-year variance including a negative 2025
- Best suited for investors with 7–10+ year horizons who can tolerate periods of significant drawdown
The Small-Cap Opportunity: What the Data Actually Says
Market Structure · Risk-Return Framework
SEBI defines small-cap companies as those ranked below 250 by market capitalization. As of 2026, this means companies with market caps broadly below ₹8,000–10,000 crore, though the exact threshold shifts as market levels change. This universe contains hundreds of businesses across virtually every sector of India's economy.
The case for small-cap investing is grounded in a specific structural argument: smaller businesses have a longer runway for growth. A company with ₹500 crore in revenue has many more ways to double than one with ₹50,000 crore. When that growth materializes, and the market recognizes it, earnings expansion combines with valuation re-rating — the combination that produces exceptional long-term returns.
The risks are equally structural. Small-cap stocks have lower liquidity — meaning a large fund buying or selling a position can itself move the price. They receive less analyst coverage, so mispricings take longer to correct — in both directions. And they are more sensitive to credit conditions, because smaller businesses often depend on bank credit more heavily than large corporations with bond market access.
Investors using a SIP Calculator to estimate long-term wealth creation should remember that these structural risks can lead to periods of sharp volatility, causing actual returns to differ significantly from projected outcomes.
India's structural growth story — manufacturing expansion, infrastructure spending, rising domestic consumption, digital adoption — disproportionately benefits smaller businesses that are closer to these trends. Large-cap companies are more exposed to global cycles and already priced for a degree of maturity. Small-caps, at their best, offer exposure to businesses still in their high-growth phase.
The challenge for individual investors is selection. The Indian small-cap universe contains over 3,000 listed companies. Identifying which ones have genuinely strong businesses, clean balance sheets, and honest management — and buying them at sensible valuations — requires both analytical resources and time that most retail investors don't have. This is the core argument for a professionally managed fund.
Fund Overview & Investment Philosophy
Investment Philosophy
HDFC Mutual Fund's stated approach for this fund centers on quality and valuation discipline rather than momentum. The fund manager targets businesses with strong financials — healthy return on equity, manageable debt, and sustainable earnings — at prices that offer a reasonable margin of safety.
This matters because many small-cap investors confuse activity with alpha. A fund that turns over its portfolio rapidly, chasing momentum stocks, may look impressive in bull markets but can suffer severe drawdowns when sentiment reverses. HDFC Small Cap's relatively lower portfolio turnover suggests a more patient ownership approach — which aligns better with the compounding logic that makes small-cap investing attractive in the first place.
What "quality discipline" means in practice
The fund avoids chasing stocks purely on price momentum. It screens for businesses that generate consistent returns on capital, have promoters with demonstrable track records, and show earnings growth that appears sustainable rather than cycle-driven. This doesn't mean the portfolio is conservative — small-caps are inherently high-risk — but it does mean the fund tends to own businesses rather than trade themes.
Portfolio Analysis: Holdings, Sectors, and Market Cap Purity
Top 10 Holdings — March 2026
Holdings data sourced from publicly available AMFI/fund factsheet disclosures. Individual stock weights are not disclosed at position level beyond what the fund itself publishes.
What the Portfolio Concentration Tells Us
Healthcare appears three times in the top 10 — Aster DM, Fortis, and KIMS — which represents meaningful sector concentration in the top holdings. This isn't necessarily a flaw: healthcare is a structural growth sector in India, and hospital chains specifically benefit from rising health insurance penetration and organized healthcare adoption. But investors should be aware that a broad-based healthcare correction (regulatory pricing pressure, policy changes to insurance reimbursement) could affect multiple top holdings simultaneously.
The financial services exposure (Bank of Baroda, Indian Bank) is interesting — both are PSU banks, which have historically traded at valuation discounts to private sector peers. The fund may be expressing a value view here: PSU banks have strengthened balance sheets post the NPA cleanup cycle and trade at lower multiples than private banks.
Great Eastern Shipping adds cyclical commodity exposure, which provides diversification from the more defensive healthcare and services holdings. The auto components position (Gabriel India) is a proxy for India's automotive supply chain growth.
Visual Analysis: Sector Allocation, Market Cap Mix & Annual Returns
Sector Allocation
As of March 2026
Market Cap Allocation
As of March 2026
Annual Returns — Calendar Year
Based on publicly available fund data. 2026 is ongoing — YTD figure not shown. Past performance does not indicate future returns.
Top Sector Weightings
Percentage of fund AUM — March 2026
Risk Metrics: What the Numbers Actually Mean
Risk metrics are frequently cited without context. Here is what each figure means for an investor evaluating this fund.
Standard Deviation
Measure of return volatility
Standard deviation measures how much the fund's annual returns fluctuate around its average. A 17.43% figure means that in most years, returns could be expected to swing roughly ±17% from the historical average. In practical terms: if the average annual return has been around 15%, a one-standard-deviation bad year could mean returns near -2% to -4%, and a one-standard-deviation good year near 30%+. This is normal for small-cap funds. For context, large-cap funds typically show standard deviations of 12–15%.
Beta
Sensitivity to benchmark movements
Beta measures how much the fund moves relative to its benchmark (BSE 250 SmallCap TRI). A beta of 0.807 means the fund has historically moved about 80.7% as much as the benchmark in either direction. When the small-cap index falls 10%, this fund has historically fallen roughly 8%. This lower-than-1.0 beta reflects the fund's quality bias — it tends to avoid the most speculative, highly volatile end of the small-cap spectrum. However, beta is calculated on historical data and provides no guarantee of future behaviour, particularly in extreme market events.
Sharpe Ratio
Return generated per unit of risk taken
The Sharpe ratio compares the fund's excess return (above the risk-free rate) to its standard deviation. A ratio of 0.447 means the fund generates 0.447 units of excess return per unit of volatility. Positive is good — it means the risk taken is being compensated. However, this ratio changes significantly across market cycles: in bull markets it rises sharply; in bear markets it can turn negative. Investors should not use the Sharpe ratio to predict future returns — it reflects the past risk-return trade-off only. A Sharpe ratio above 0.5 is generally considered reasonable; 0.447 is positive but not exceptional.
Important limitation of all these metrics
Standard deviation, beta, and Sharpe ratio are all backward-looking. They describe the past distribution of returns, not the future. A fund that showed low beta during a relatively calm period may exhibit much higher beta during a genuine market crisis. These figures are useful for comparison across similar funds — not as absolute predictors of outcome.
SIP Wealth Creation: Projections and Their Honest Limitations
SIP projections are among the most frequently misused tools in personal finance. They are useful for illustrating the power of consistent investing and compounding — but they are mathematical models, not forecasts. The actual corpus an investor accumulates will depend on the specific return path, not just the average.
With that context, here are illustrative projections for a ₹5,000 monthly SIP, using three different assumed CAGRs to show the range of possible outcomes rather than a single number.
Notice that the difference between a 10% and 15% CAGR over 15 years is roughly ₹12–13 lakh on a ₹9 lakh investment. This illustrates why the return rate matters enormously over long periods — but also why the assumption of a constant 15% CAGR is optimistic. The fund delivered approximately 44.8% in 2023, -0.6% in 2025, and 20.4% in 2024. The average looks good; the year-to-year path does not feel smooth.
SIPs do help smooth this volatility — by investing fixed amounts each month, investors automatically buy more units when prices are lower (market corrections) and fewer when prices are high. This rupee-cost averaging effect can improve outcomes compared to lump-sum investing at a single point, particularly for small-cap funds where timing risk is highest.
HDFC vs Nippon India Small Cap: A Genuine Comparison
Both are very large small-cap funds (AUM above ₹30,000 crore each), which itself creates a challenge: funds this large can struggle to deploy capital quickly into small-cap stocks without moving prices. The comparison below reflects portfolio characteristics rather than predicted future performance.
The AUM consideration
At nearly ₹39,000 crore, HDFC Small Cap is one of the largest funds in a category where size creates real constraints. Buying a meaningful position in a ₹500 crore market-cap company when you manage ₹39,000 crore is genuinely difficult without moving the price. This is not a dealbreaker, but it is worth understanding: very large small-cap funds may gradually look more like mid-cap funds over time as they find fewer suitable small-cap opportunities at scale. Investors should monitor the market-cap allocation table in quarterly factsheets.
What Institutional Investors Are Watching in 2026
Large fund managers don't evaluate small-cap funds (or the underlying stocks) in isolation. They track macro and structural variables that determine whether the small-cap earnings cycle can sustain or accelerate. Here is what is genuinely on their radar:
Government capital expenditure and infrastructure spending
Government capex — roads, railways, defence manufacturing, water infrastructure — disproportionately benefits small and mid-cap companies that supply components, construction materials, and services. The pace of government spending in FY26 and FY27 directly affects the order books of many small-cap industrial and capital goods companies. A slowdown due to fiscal consolidation would be a headwind.
Credit availability and interest rate direction
Small companies rely more heavily on bank credit than large corporations. When rates are high or credit conditions tighten (as in 2022–23), smaller businesses feel the squeeze first — through higher borrowing costs and slower receivable collection. RBI's rate trajectory in 2026 and the pace of credit growth to MSMEs are variables institutional investors monitor closely for small-cap earnings risk.
Small-cap valuations relative to historical ranges
After the 2023 bull run (when HDFC Small Cap returned 44.8%), small-cap valuations expanded significantly. The 2025 performance (-0.6%) was partly a digestion of those elevated valuations. Institutional investors compare current P/E and P/B ratios for the small-cap index against 5 and 10-year historical ranges. Entering when valuations are compressed has historically produced better outcomes than entering at peak optimism.
Healthcare sector regulatory risk
Given the fund's significant healthcare exposure (3 of top 10 holdings), policy changes around drug pricing, hospital tariff regulation, or health insurance reimbursement frameworks could materially affect multiple holdings simultaneously. This is a sector-specific risk that requires monitoring distinct from general market risk.
Bull, Base, and Bear Scenarios for 2026–2028
Institutional investors rarely rely on a single forecast. Evaluating a range of scenarios — and the probability weight assigned to each — is more useful than any point estimate.
Bullish Scenario
Probability: ~35%Key conditions required:
- GDP growth sustains at 6.5–7% with private investment picking up
- RBI rate cuts improve credit availability and reduce borrowing costs for small businesses
- Government capex continues at elevated pace, driving manufacturing order books
- Global risk-on environment supports FII flows into emerging markets
Potential outcome: Small-cap earnings reaccelerate. Valuations re-rate upward. Fund likely delivers above 20% CAGR over 3 years from current levels.
Base Scenario
Probability: ~50%Key conditions:
- Stable but not accelerating GDP growth (5.5–6.5%)
- Moderate inflation, gradual rate normalization
- Consistent government spending, some private investment recovery
- Small-cap earnings grow in line with nominal GDP (10–15%)
Potential outcome: Steady compounding at 12–15% CAGR. Periods of volatility but no prolonged bear market. Long-term SIP investors benefit from consistency.
Bearish Scenario
Probability: ~15%Key conditions:
- Global slowdown or financial stress event triggers FII outflows
- Domestic credit tightens sharply — NBFC or banking stress resurfaces
- Small-cap earnings disappoint as demand slows and input costs remain elevated
- Valuation compression accelerates from still-elevated starting levels
Potential outcome: Fund could fall 30–40% from current levels in a severe scenario. Recovery typically takes 2–4 years. SIP investors who continue investing through the drawdown generally recover faster than lump-sum investors who entered at the peak.
Related Resource
Best Small Cap Mutual Funds in India 2026
Compare HDFC Small Cap with the top-ranked small-cap funds — Nippon, SBI, Axis, Quant and more — in one place.
Who Should — and Should Not — Invest
✓ Well suited for:
- Investors with 7–10+ year horizon
- Young earners starting SIPs early
- Investors who can hold through 30–40% drawdowns without panic-selling
- Those who want quality-biased small-cap exposure vs pure momentum
- Investors using small-cap as a satellite allocation (20–30% of equity portfolio)
✗ Not suited for:
- Investors with under 5-year horizon
- Conservative or capital-preservation investors
- Those approaching retirement who cannot absorb volatility
- Anyone using short-term market momentum as an entry signal
- Investors who plan to exit immediately during any correction
Action Plan for Retail Investors
Define your horizon first. If you cannot commit to 7+ years, this fund category is not suitable regardless of past returns.
Limit allocation to 20–30% of your equity portfolio. Small-cap should complement, not dominate. Core allocation belongs in diversified large/flexi cap funds.
Use SIPs rather than timing lump-sum entry. Small-cap valuations are difficult to time. Monthly SIPs smooth entry risk and automate discipline.
Review annually, not monthly. Checking small-cap fund performance monthly creates behavioral pressure to exit at exactly the wrong time. Annual review is sufficient.
Monitor the market cap purity. Check quarterly factsheets. If the fund's small-cap allocation drops significantly below 65%, it may be gradually becoming a different fund than the one you selected.
Looking to compare multiple small-cap funds?
Read our ranked analysis: Best Small Cap Mutual Funds in India 2026 →