Why Most Retail Investors Lose Money:
A Complete Market Psychology Case Study
Platform: Vitharthi Financial Insights | Level: Beginner–Intermediate
Every year, millions of people open demat accounts, watch stock market videos, follow finance influencers, join Telegram groups, subscribe to premium channels, and start investing with dreams of financial freedom.
Most of them begin their journey with excitement. The logic appears simple.
A few months later, reality arrives. The same investor who was confidently discussing multibagger stocks now finds himself staring at a portfolio showing losses. Panic begins to replace confidence. Every market fall feels like a disaster. Every rally feels like a missed opportunity.
Eventually, many investors quit altogether and conclude that the stock market is nothing more than gambling. But here's the interesting part.
The market is not designed to take money from retail investors.
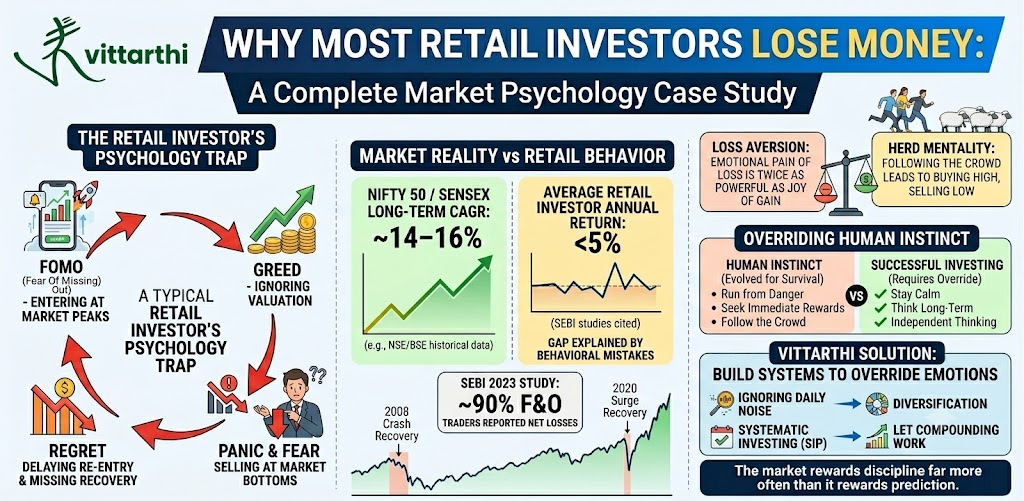
Instead, retail investors often lose money because they repeatedly make predictable psychological mistakes. The biggest enemy of an investor is usually not inflation, recession, interest rates, foreign investors, geopolitical events, or even market crashes. The biggest enemy is often the person staring back from the mirror.
Most investors do not lose because of lack of information. They lose because they cannot control their emotions when money is involved.
What the Data Actually Says
Before diving into psychology, it is important to understand what the numbers tell us. India's equity markets have delivered remarkable long-term returns — yet most retail investors have failed to capture them.
(Source: NSE)
(Source: BSE)
(SEBI studies)
(SEBI report)
The gap between what the market offers and what most retail investors actually earn is massive — and it is almost entirely explained by behavioral mistakes, not stock selection.
Today we live in an era where information is available instantly. A retail investor can access company annual reports, quarterly earnings, economic data, market news, expert interviews, technical analysis tools, AI-powered investing platforms, and financial influencers on social media.
Yet despite having access to more information than any previous generation in history, a large percentage of retail participants continue to underperform the market. Because investing success is not primarily an information problem. It is a behavior problem.
| What People Think | Reality |
|---|---|
| More information = More profits | More information often creates confusion and overtrading |
| More trading = Better returns | Overtrading destroys returns through costs and emotion |
| Market prediction creates wealth | Patience and compounding create wealth |
| Hot tips generate success | Discipline and process generate success |
Why Humans Are Naturally Bad Investors
The stock market is one of the few places where natural human instincts become liabilities. For thousands of years, survival depended on reacting quickly to danger — fear protected humans from predators, following the crowd increased survival chances, and avoiding uncertainty reduced risk. These behaviors were useful in nature. Unfortunately, they become dangerous in financial markets.
Human Instinct (Evolved for Survival)
- Follow the crowd
- Run from danger immediately
- Seek immediate rewards
- Avoid uncertainty at all costs
Successful Investing (Requires Override)
- Think independently
- Stay calm during market fear
- Focus on long-term rewards
- Accept and sit with uncertainty
Case Study: The Same Investor, Two Different Markets
Let us imagine an investor named Rahul. Rahul enters the market during a strong bull run. Stocks are rising every week. Social media is full of success stories. Friends are discussing profits. News channels are optimistic. Rahul feels confident. He starts believing his profits are the result of his skill.
Then a correction begins. Stocks fall 10%, then 15%, then 20%. The same investor who felt fearless now starts questioning every decision. He stops looking at long-term fundamentals and focuses only on daily price movements. Eventually, he sells near the bottom. Months later, the market recovers. Rahul buys back at higher prices.
This cycle repeats across generations. Different investors. Different decades. Same psychology.
The Fear and Greed Cycle That Repeats Every Market Cycle
Every major bull market and every major crash follows a surprisingly similar emotional pattern. Technology changes. Industries change. Governments change. But human emotions remain exactly the same.
| Market Stage | Dominant Emotion | Typical Investor Action | What Should Be Done |
|---|---|---|---|
| Early Recovery | Doubt | Stay Away | Accumulate gradually |
| Bull Market | Optimism | Start Buying | Invest systematically |
| Market Peak | Greed / Euphoria | Buy Aggressively | Exercise caution, rebalance |
| Bear Market | Fear | Sell Holdings | Evaluate fundamentals |
| Market Bottom | Panic / Despair | Exit Completely | Best buying opportunity |
Ironically, investors usually buy the most when risk is highest and sell the most when opportunity is greatest. This single behavioral pattern explains a significant percentage of retail investor underperformance.
📊 Chart 1
Fear vs Greed Cycle — Investor Emotion vs Market Level
How retail investor emotions typically move opposite to smart money action across a full market cycle.
FOMO: The Silent Wealth Destroyer
FOMO stands for Fear Of Missing Out. It is one of the most powerful forces in financial markets. Imagine a stock that has already doubled in six months. You did not buy it. Now every social media platform is discussing it. Friends are posting screenshots. Financial influencers are calling it the next multibagger.
At this point, many investors stop analyzing. They start chasing. And chasing often happens near market tops. Professional investors focus on valuation. Retail investors often focus on recent price movement. That difference changes everything.
Why Losses Hurt More Than Profits Feel Good
Psychologists Daniel Kahneman and Amos Tversky demonstrated through their landmark Prospect Theory research that the emotional pain of losing ₹10,000 is roughly twice as powerful as the happiness created by gaining ₹10,000. This phenomenon is known as Loss Aversion — and it explains why investors behave irrationally during market declines.
Loss Aversion Behavior (Harmful)
- Checking portfolio every hour
- Panic selling on red days
- Avoiding all market news
- Emotional, impulsive decisions
Rational Behavior (Productive)
- Review fundamentals, not prices
- Evaluate business valuations
- Maintain planned allocation
- Focus on 5–10 year outcomes
Many investors do not sell because fundamentals changed. They sell because losses make them uncomfortable. The market understands this weakness and exploits it repeatedly.
Market History Never Repeats Exactly, But Psychology Does
One of the biggest misconceptions is that every market crash is unique. The headlines may be different. The causes may be different. But the emotional reactions remain surprisingly similar — fear, panic, uncertainty, then eventually recovery.
Every major market crash feels permanent while it is happening. Almost none of them actually are. The Nifty 50 has recovered from every single correction in its history — including 2001, 2008, 2013, 2016, 2020, and 2022.
Case Study #1: The 2008 Financial Crisis
The 2008 Global Financial Crisis remains one of the most important lessons in market psychology. Banks were collapsing. Financial institutions were under pressure. Many investors genuinely believed the financial system itself was in danger.
📊 Chart 2
2008 Financial Crisis — Nifty 50 Crash & Recovery
From the Jan 2008 peak to the full recovery by 2013. Indexed to 100 at Jan 2008.
The Nifty 50 fell approximately 60% from its January 2008 peak to its March 2009 low. However, by 2013 — just five years later — the index had fully recovered and surpassed its previous highs. Investors who held quality businesses through the crash recovered fully. Those who panic-sold near the bottom locked in permanent losses.
Case Study #2: The COVID-19 Crash of 2020
If 2008 tested financial confidence, 2020 tested emotional resilience. During the early stages of the pandemic, uncertainty reached extreme levels. Businesses were shutting down. Travel stopped. Many investors believed markets would continue falling for years.
📊 Chart 3
COVID-19 Crash 2020 — Nifty 50 Timeline
The fastest crash and one of the sharpest recoveries in Indian market history.
The Nifty 50 fell nearly 38% in just 40 trading days. Yet within 6 months, the index had recovered to pre-crash levels. By the end of 2021, Nifty 50 was approximately 130% above its March 2020 bottom. Most retail investors who exited in fear never fully re-entered in time to capture this recovery.
"I'll buy when things become clear" is the most expensive sentence in investing.
The Silent Wealth Destroyer: Inflation
One concept that most beginner investor guides skip entirely — and one that is absolutely critical to understand — is inflation's effect on real returns. Earning a nominal return means nothing if inflation is eating away at the purchasing power of that money.
| Asset | Approx. Nominal Return | Approx. Real Return (After Inflation) | Verdict |
|---|---|---|---|
| Fixed Deposit | 6.5–7.5% | 0.5–2% | Barely beats inflation |
| Savings Account | 3–4% | Negative | Loses real value |
| Gold (long-term) | ~8–10% | 2–4% | Moderate hedge |
| Equity / Nifty 50 | ~13–16% CAGR | 7–10% | Strong real growth |
This is why keeping all savings in an FD or savings account is not a "safe" choice — it is a guaranteed way to slowly lose purchasing power over time. Equity investing, despite short-term volatility, has historically been one of the most effective inflation-beating asset classes available to Indian investors.
Why "50-20-20-10" Is Not a Universal Formula
Many articles present a single asset allocation as if it is a rule for everyone. It is not. A 25-year-old salaried professional with no dependents should have a completely different allocation from a 55-year-old approaching retirement.
| Investor Profile | Equity % | Debt % | Reasoning |
|---|---|---|---|
| Age 22–30 (High risk) | 75–85% | 10–15% | Long time horizon; can absorb volatility |
| Age 30–45 (Mod risk) | 55–70% | 20–30% | Balancing growth with stability |
| Age 45–55 (Lower risk) | 35–50% | 35–45% | Capital preservation becomes important |
| Age 55+ (Retirement) | 20–35% | 50–60% | Income stability over growth |
Real Estate: High Capital vs. REITs
Direct real estate investment requires massive capital (₹30L+), has low liquidity, and high transaction costs. For salaried investors, REITs (Real Estate Investment Trusts) offer exposure to commercial real estate from as low as ₹500, are fully liquid on the NSE/BSE, and provide regular dividend income.
Planning physical real estate? Calculate your capacity first.
Use Vittarthi's Home Loan EMI CalculatorThe Power of Compounding — With Real Numbers
Most people imagine wealth is created through perfect stock picks. Reality is different. Long-term wealth is created through consistent investing (SIPs), patience, compounding, and emotional discipline.
| Monthly SIP Amount | Duration | Total Invested | Approx. Final Value (@12%) |
|---|---|---|---|
| ₹5,000/month | 20 years | ₹12 Lakhs | ~₹49.9 Lakhs |
| ₹10,000/month | 20 years | ₹24 Lakhs | ~₹99.9 Lakhs |
| ₹10,000/month | 30 years | ₹36 Lakhs | ~₹3.5 Crore |
Notice that in the 30-year example, ₹36 Lakhs invested grew to ₹3.5 Crore — the additional ₹3.14 Crore came entirely from compounding. This is the "eighth wonder of the world" that many investors fail to access simply because they panic-sell during market corrections.
Don't break the compounding chain. Automate your discipline.
Calculate SIP Returns on VittarthiHow Successful Investors Think Differently
Successful investors are not necessarily the smartest people in the room. They do not always predict market tops or bottoms. What separates them is simple: They have a system that prevents emotions from making decisions.
| # | The 10 Rules | Why It Matters |
|---|---|---|
| 1 | Invest regularly (SIP) | Rupee-cost averaging reduces entry risk |
| 2 | Avoid FOMO | Momentum stocks often reverse sharply |
| 3 | Maintain emergency fund | 6–12 months expenses prevents forced selling |
| 4 | Diversify wisely | Reduces concentration risk in one sector |
| 5 | Focus on quality | Quality companies recover from crashes |
| 6 | Ignore daily noise | Daily prices are irrelevant to 10-year goals |
| 7 | Think in years, not weeks | Time in market beats timing the market |
| 8 | Review periodically | Maintain discipline (Quarterly/Annually) |
| 9 | Accept volatility | Volatility is the price of long-term returns |
| 10 | Trust the process | Systems beat willpower under pressure |
The Vittarthi Wealth Creation Framework
Step 1: Earn More & Save Consistently (Target saving at least 20–30% of net income)
Step 2: Protect Against Emergencies First (6–12 months in a liquid fund)
Step 3: Get Adequately Insured (Term and health insurance are non-negotiable)
Step 4: Invest Systematically (Use SIPs in diversified mutual/index funds)
Step 5: Ignore Short-Term Noise (Check portfolio quarterly, not daily)
Step 6: Let Compounding Work (Do not break the chain during corrections)
Final Conclusion: The Market Is a Mirror
Most retail investors lose money because they follow their emotions. The most successful investors build systems that prevent emotions from taking control.
The market rewards discipline far more often than it rewards prediction.
Frequently Asked Questions (FAQs)
Why do most retail investors lose money in the stock market?
Most retail investors lose money because of emotional decision-making, poor risk management, FOMO investing, panic selling during corrections, and lack of long-term discipline. A 2023 SEBI study found that ~90% of individual F&O traders reported net losses.
What is the biggest psychological mistake investors make?
Allowing fear and greed to influence investment decisions. Investors frequently buy when prices are high (driven by greed and FOMO) and sell when prices are low (driven by fear and panic) — the exact opposite of what creates wealth.
How can investors avoid emotional investing?
By creating a written investment plan, automating SIPs, maintaining an emergency fund (so you never need to sell in a panic), focusing on long-term goals, limiting portfolio-checking to quarterly reviews, and ignoring daily market news.
What should I do during a stock market crash?
Do not panic-sell quality long-term holdings. If you have surplus cash, market crashes are historically the best buying opportunities. Continue SIPs — you will be purchasing more units at lower prices (rupee-cost averaging). Recall that Nifty recovered fully from its March 2020 COVID crash within 6 months.